This article was written by Matt, whom has invested hundreds of hours into researching the disappearance case of Kris Kremers and Lisanne Froon.
Matt is a member of the Imperfect Plan team and has written numerous articles, including the following:
- A Deep Analysis of The Night Photos
- Timestamps Of Missing Daytime Photos
- Forensic Analysis of Phone Data
- Missing Photo #509 – Field Testing The Canon Powershot SX270 HS
Additionally, Matt was our central point of contact and provided critical support during the team’s expedition in Panama.
If you’re new to the disappearance case of Kris Kremers and Lisanne Froon, we suggest that you check our Case Articles page.
After Kris Kremers and Lisanne Froon disappeared on the Pianista trail, their blue backpack was later found on the bank of a river by a Ngobe tribe woman. Inside of the blue backpack was Kris and Lisanne’s handheld camera, which contained numerous daytime photos and nighttime photos. Digital photos contain meta-data, called “EXIF data”, which consists of small pieces of information such as image resolution, dimensions, shudder speed, if the flash was used, etc. EXIF data is stored inside of the photos themselves, at the time that each photo is captured.
This is Matt’s further investigation into the night photos that were found on Kris and Lisanne’s camera.
Introduction
This article examines specific temperature EXIF data that was recently extracted from the night photos (Image 510 to Image 610). The data was kindly provided by Jürgen Snoeren (JurgenSnoeren.com). The night images that the Imperfect Plan team previously has access to did not contain this specific EXIF data.
It should also be noted that Jürgen has published a book with Marja West about the case: “Lost in the Jungle” (Verlorenindejungle.nl).
Before looking at the actual data it is necessary to consider that this data comes from and represents a period of time of pain and anguish of two young women, Kris Kremers and Lisanne Foon. While examining this data this should be considered; and discussion of this data should be done in a respectful manner. This article intends to do this and also intends to disprove some rather creative speculations about the night photos.
Overview Of The Camera Sensor
First, let’s look at where the data comes from and how it is determined during use.
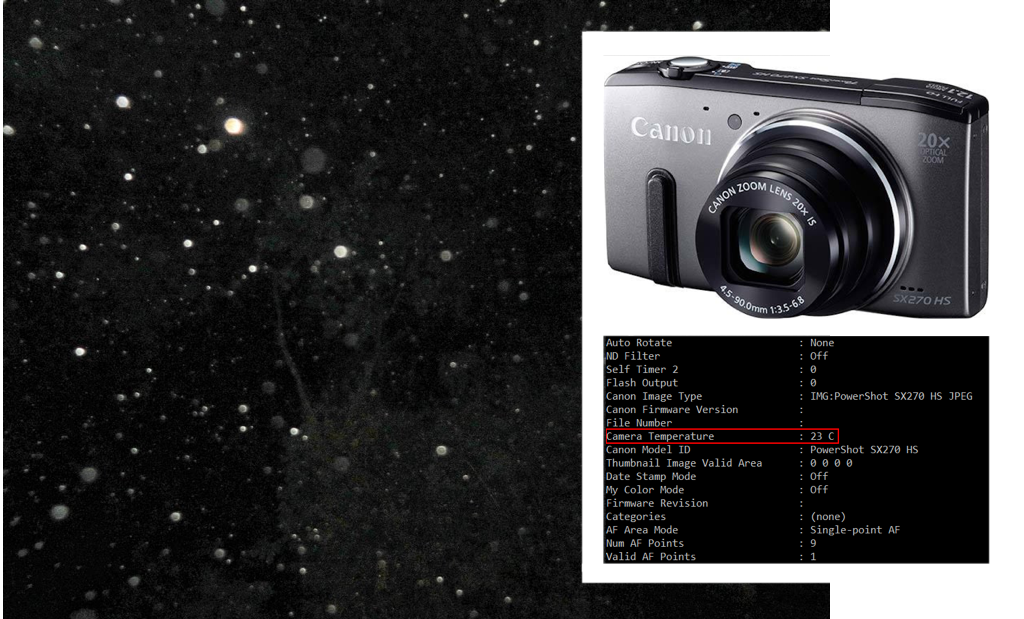
The Canon SX270 HS has a built-in temperature sensor. This sensor is most likely a simple base-level sensor. Where the sensor is located inside the body of the camera is not known. The sensor could be either a discrete sensor, mounted on the circuit board, or it could be incorporated into one of the integrated circuits itself. The sensor’s location could have an impact on how quickly the recorded temperature changes based on ambient temperature. It’s location, however, not overly relevant to analyzing this data. Overall, data recorded by the sensor was sufficient to make some important observations.
The purpose of the temperature sensor is most likely to measure the internal temperature of the camera and to prevent it from overheating, rather than taking a precise measurement of the ambient temperature. Overheating could occur when the flash is used extensively, especially in warm environments.
The camera stores a measurement taken by this sensor in the EXIF data of the image, every time a photo is captured.
Below is EXIF extract from an image taken by the Canon SX270 HS. The camera temperature is stored as an integer value, which is a whole number without decimals.
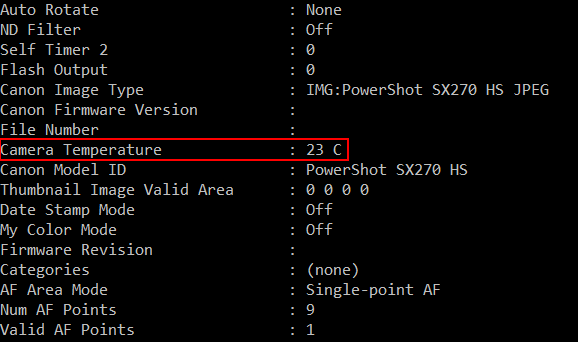
It is likely that the camera’s temperature is initially measured with higher resolution but is only stored as an integer because the temperature reading is not intended to be a precision measurement. Instead, this temperature is utilized internally to determine if the camera’s temperature exceeds a certain threshold. This prevents heat damage to the internal electronics, and permits the camera to shut down or warn the user if it is overheating.
Unfortunately, this makes this data somewhat less useful because Canon does not published precisely how the camera’s sensor data is processed. For example, is the temperature reading rounded or simply truncated?
The temperature also does not allow us to distinguish small temperature changes, because they are all rolled into the same integer.
For example the values 22.5, 22.6, 22.7, 22.8, 22.9, 23.0, 23.1, 23.2 and 23.4 would all be rounded into the same integer 23. It is furthermore possible that the decimal point is simply truncated and that the values 23.0, 23.1, 23.2, 23.4, 23.5, 23.6, 23.7, 23.8 and 23.9 would be truncated into 23.
Let’s look at an example in the table below. Please note that the data in the following table is not related to the disappearance case and only serves as an example to understand the possible inner-programming of the camera.
The first column (Decimal) are examples of data with one decimal point. In the second column (Truncated) are the same values, but the values after the decimal point are simply truncated and in the third column (Rounded) are the decimal values but rounded to no decimal point.
| # | Decimal (xx.x) | Truncated (xx) | Rounded (xx) |
|---|---|---|---|
| 1 | 23.9 | 23 | 24 |
| 2 | 22.4 | 22 | 22 |
| 3 | 22.5 | 22 | 23 |
| 4 | 23.6 | 23 | 24 |
| 5 | 22.9 | 22 | 23 |
| 6 | 23.0 | 23 | 23 |
| 7 | 23.4 | 23 | 23 |
| 8 | 23.2 | 23 | 23 |
| 9 | 23.6 | 23 | 24 |
| 10 | 22.1 | 22 | 22 |
| 11 | 23.4 | 23 | 23 |
| 12 | 23.4 | 23 | 23 |
| 13 | 23.5 | 23 | 24 |
| 14 | 23.4 | 23 | 23 |
| 15 | 23.4 | 23 | 23 |
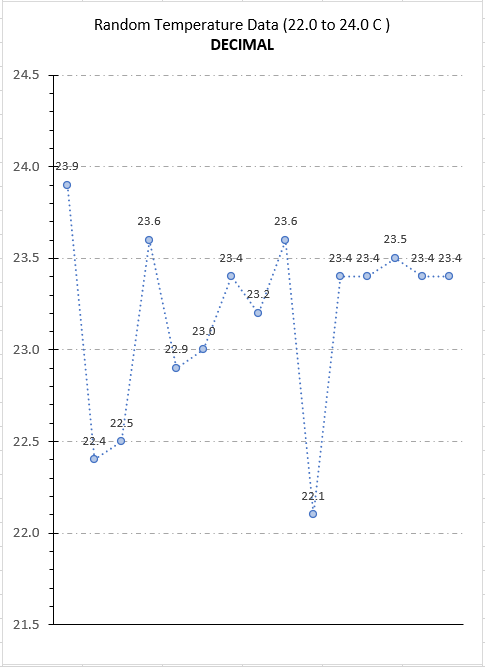
It is easier to see trends by graphing numbers, so let’s graph them.
The graph below shows the decimal values and small changes in temperature:
The next graph shows the truncated data, without decimals, as is similar to the way in which the camera recorded the temperature data.
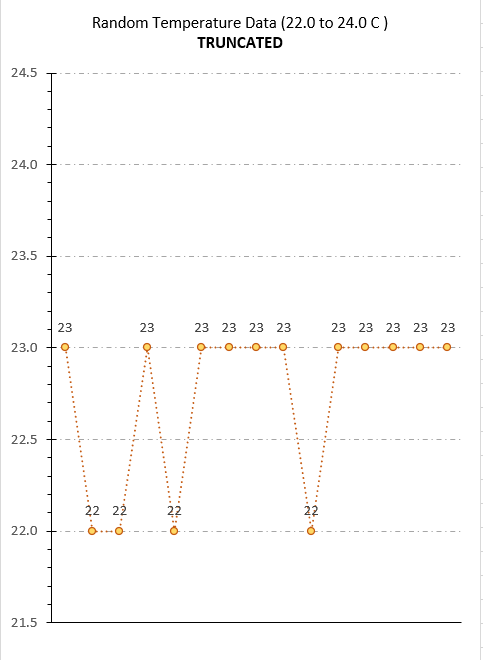
In the chart above, it’s immediately visible how a lot of information is lost by excluding the decimal values. Rather than including small changes, we’re only able to observe large changes, which are jumping between full numbers. Therefore, it is not possible to observe any small changes in temperature.
Lastly the rounded data also only shows large jumps and no small changes in the data.
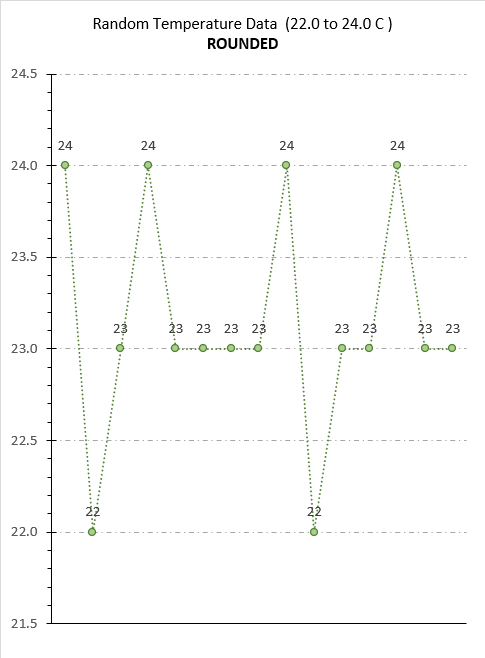
All three graphs above are based on the same data. Only in the last two graphs, the data was rounded to the nearest whole number, and therefore truncated.
The final whole numbers are similar to the way in which the camera logged each photo’s EXIF temperature data.
In summary, a small change in the camera’s temperature may appear as a change of a full degree and conversely small changes in temperature may appear as no change or stable temperature. Data may show large sudden jumps in temperature, however those may in reality be only very small changes.
It is important to remember these value changes when reviewing the real temperatures so that they can be interpreted correctly.
Raw Night Photo Temperature Data
The EXIF Temperature data from every night image is shown in the table below.
The temperature of 21 C from the first image (Photo 510) is most likely the temperature of the environment that the camera was in before the first image was taken. A temperature of 21 C would be realistic for the ambient night temperature in April in these approximate regions of Panama. This temperature is similar to the night temperatures that the Imperfect Plan team encountered during their expeditions and it can be assumed the camera was in ambient temperature before Image 510 was taken. This means the camera was likely not in someone’s hand, nor in someone’s pocket. The camera must have been either placed on the ground or had been sitting in the blue backpack. Had the camera been in someone’s hand or pocket, the temperature of the camera would likely have been higher, as we’ll see in the following experiments.
| Image # | EXIF Temperature (C) |
|---|---|
| Image 510 | 21 |
| Image 511 | 21 |
| Image 512 | 21 |
| Image 513 | 21 |
| Image 514 | 21 |
| Image 515 | 21 |
| Image 516 | 21 |
| Image 517 | 21 |
| Image 518 | 21 |
| Image 519 | 22 |
| Image 520 | 22 |
| Image 521 | 22 |
| Image 522 | 22 |
| Image 523 | 22 |
| Image 524 | 22 |
| Image 525 | 22 |
| Image 526 | 22 |
| Image 527 | 22 |
| Image 528 | 22 |
| Image 529 | 22 |
| Image 530 | 22 |
| Image 531 | 23 |
| Image 532 | 23 |
| Image 533 | 23 |
| Image 534 | 23 |
| Image 535 | 23 |
| Image 536 | 24 |
| Image 537 | 23 |
| Image 538 | 24 |
| Image 539 | 24 |
| Image 540 | 24 |
| Image 541 | 24 |
| Image 542 | 24 |
| Image 543 | 24 |
| Image 544 | 24 |
| Image 545 | 24 |
| Image 546 | 24 |
| Image 547 | 24 |
| Image 548 | 24 |
| Image 549 | 24 |
| Image 550 | 24 |
| Image 551 | 25 |
| Image 552 | 25 |
| Image 553 | 25 |
| Image 554 | 25 |
| Image 555 | 25 |
| Image 556 | 25 |
| Image 557 | 25 |
| Image 558 | 25 |
| Image 559 | 25 |
| Image 560 | 25 |
| Image 561 | 25 |
| Image 562 | 25 |
| Image 563 | 25 |
| Image 564 | 25 |
| Image 565 | 26 |
| Image 566 | 26 |
| Image 567 | 26 |
| Image 568 | 26 |
| Image 569 | 26 |
| Image 570 | 26 |
| Image 571 | 26 |
| Image 572 | 26 |
| Image 573 | 26 |
| Image 574 | 26 |
| Image 575 | 26 |
| Image 576 | 26 |
| Image 577 | 27 |
| Image 578 | 27 |
| Image 579 | 27 |
| Image 580 | 27 |
| Image 581 | 26 |
| Image 582 | 26 |
| Image 583 | 26 |
| Image 584 | 26 |
| Image 585 | 26 |
| Image 586 | 26 |
| Image 587 | 26 |
| Image 588 | 26 |
| Image 589 | 27 |
| Image 590 | 27 |
| Image 591 | 27 |
| Image 592 | 27 |
| Image 593 | 27 |
| Image 594 | 27 |
| Image 595 | 28 |
| Image 596 | 27 |
| Image 597 | 26 |
| Image 598 | 26 |
| Image 599 | 27 |
| Image 600 | 27 |
| Image 601 | 27 |
| Image 602 | 28 |
| Image 603 | 28 |
| Image 604 | 28 |
| Image 605 | 29 |
| Image 606 | 33 |
| Image 607 | 33 |
| Image 608 | 32 |
| Image 609 | 33 |
The graph below shows the temperatures plotted over the times the image was taken.
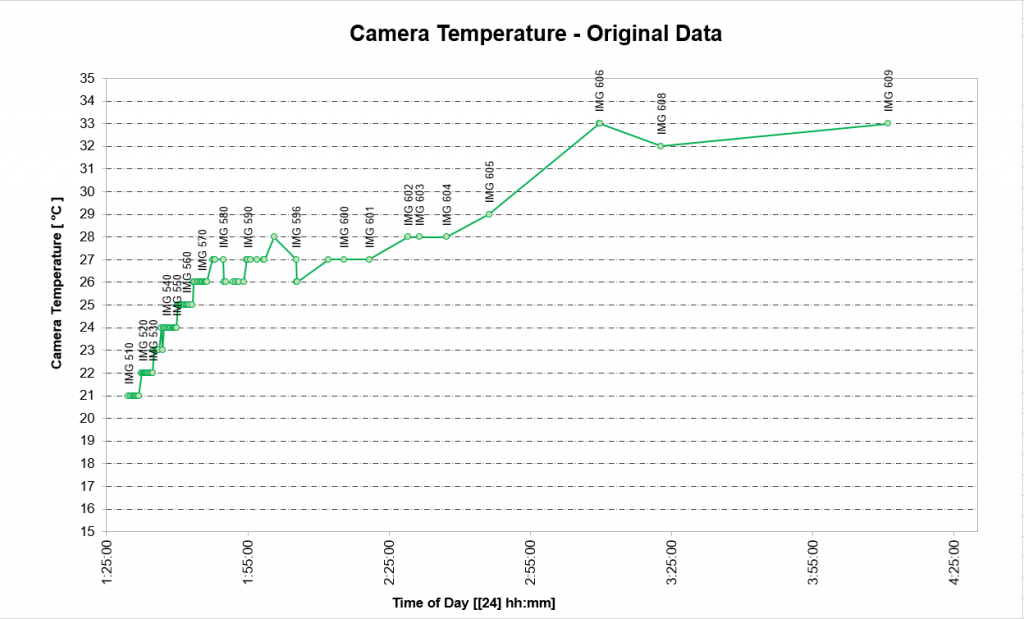
The graph can be broken into three distinct areas:
- Area 1: Where many images are taken in short succession and where the temperature rises quickly at a very constant rate.
- Area 2: Where images are taken at a slower rate and the temperature remains reasonably stable.
- Area 3: Where images are taken at a very low rate and the temperature increases slowly.
Here are the areas on the graph:
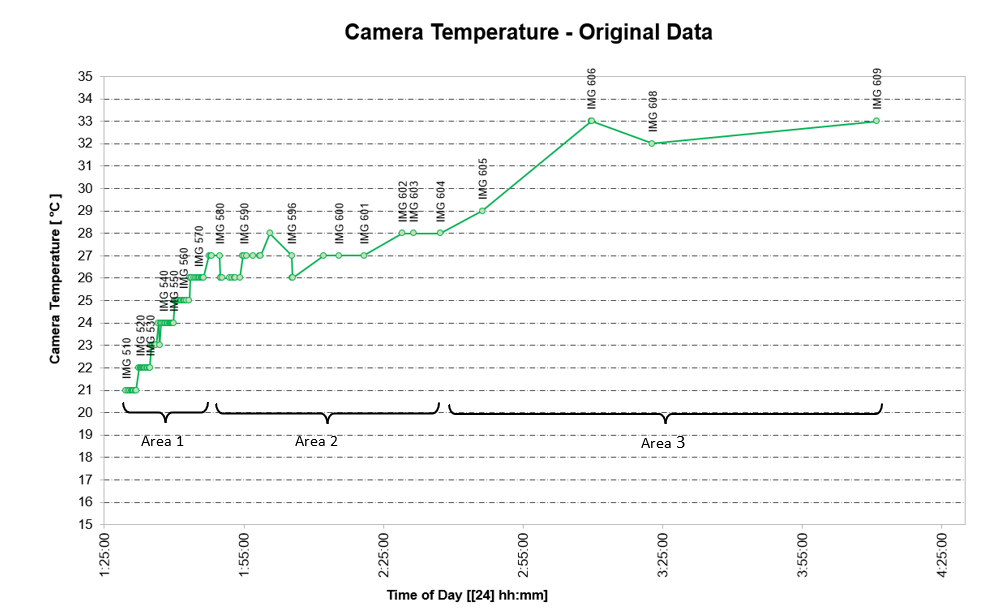
Area 1 shows what is expected when the camera takes a long series of images with the camera’s flash. The camera heats itself from use, especially when using the flash. The camera temperature increases in increments of +1 C and many points are observed having the exact same temperature, which illustrates that the camera only stores integer values.
Area 2 shows the temperature jumping up and down slightly which at first sight appears unnatural, however this is likely also caused by the temperature being stored as integer values. A very small increase or decrease of the camera temperature, caused by the camera having enough time between images to cool down slightly, would cause the stored temperature value to change by a full 1 C.
Area 3 shows unexpected behavior where the temperature increases despite the rate, at which images are taken, is very low. This is not what is expected. It would rather be expected that the temperature drops closer to 21C as the camera is not used for longer periods of time.
Experiments To Identify Normal Temperature Behavior
To find out if the observed camera temperature behavior is normal, it is necessary to conduct an experiment.
The experiment requires 99 images to be taken at the exact same time intervals that photos 510 – 609 were captured, in a dark environment with the same ambient temperature of 21 C.
After performing the experiment, the new temperature data can then be compared to the temperature data of the real night photos that Kris and Lisanne had taken. It is necessary to perform this experiment in darkness because the camera’s flash intensity automatically adjusts based on the ambient light. In complete darkness the flash will be triggered at its maximum power and therefore leading to the quickest increase in temperature.
Constructing The Robot
This was a challenging experiment to perform, primarily due to the very random intervals that the original photos were taken, and the long span of time that the original photos were taken (approximately 2.5 hours).
Therefore, to overcome these challenges, a little robot “Rudy” was built.
Rudy is a very crude robot, that consists of a wooden frame to hold the components and camera in place, a servo to actuate the camera’s shutter button and lastly an Arduino based microprocessor that operates the servo.
Below is a picture of Rudy with the Canon SX270 HS, the same exact model camera that Kris and Lisanne used.
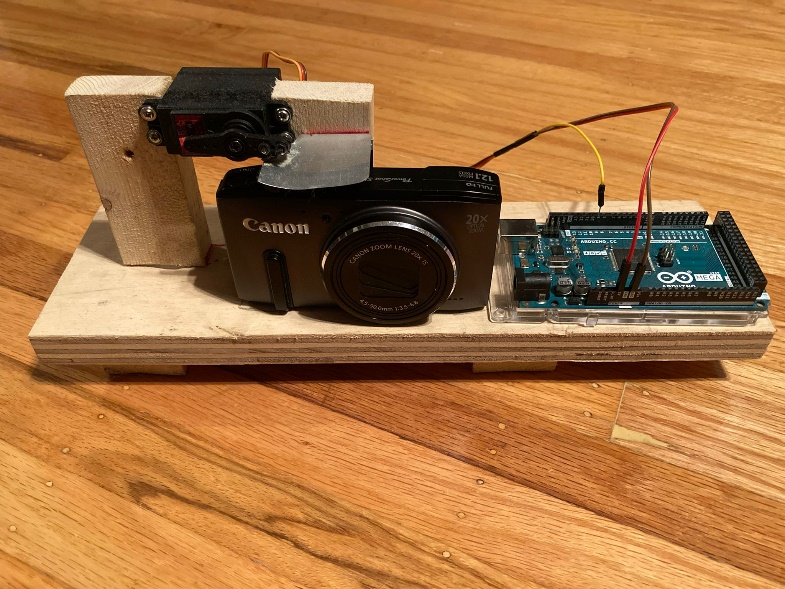
The microprocessor was then programmed with the duration in milli seconds between the real night pictures and instructed to actuate the servo to press the shutter button after each interval.
For the camera to take a photo in complete darkness it had to complete four steps:
- Achieve Focus
- Calculate Exposure
- Charge Flash
- Take Image
Focus: The camera has a simple autofocus based on contrast detection. Without going into too much detail, the camera will try to find the focus position that shows the highest image contrast, which in return usually means that focus is achieved. It can easily be imagined that an object with clear edges will show a high contrast edge, while if it was not in focus, it will leave a blurry edge with low contrast. In complete darkness this process will fail, unless the Autofocus assist light can provide enough light, and the camera will either default to a set focus distance or if it miscalculates the focus distance, it will focus on a random distance. What matters for our experiment is only that this takes some time, the actual focus is irrelevant.
Exposure: For the camera to take an image it will also try to calculate the correct exposure and set ISO speed, aperture and shutter speed accordingly. In complete darkness it will try to capture the maximum amount of light and set those parameters to achieve this. The details are irrelevant and it is again only important that this takes some time.
Flash: Lastly the camera will wait until the flash is charged (if flash is needed for correct exposure).
This entire process takes somewhere in the range of 3-7 seconds. The difficulty is that Rudy does not know when the camera actually takes a photo. It would have been possible to give Rudy a feedback sensor to know when the camera took an image but this would have added a lot of complexity and is not needed.
Thus, Rudy has to press the shutter long enough to assure that the camera has enough time to take the picture. Rudy was programmed to press the shutter for 3000 ms, which resulted in the shots being taken in most cases. But the real night photos that were taken so quickly that it was not possible for Rudy to take all pictures and he consistently missed images 563 and 580.
Experiment 1 – Camera Always On
Now, on to the experiment.
Test Conditions
Camera: Canon SX270 HS
Settings: Auto, Camera prevented to go to sleep mode
Ambient Temperature: 21 C
Ambient Light: Complete Darkness
Rudy was activated and took the pictures. The camera temperature was then extracted from the EXIF data and plotted (see graph below). The camera settings were configured to prevent it from going to sleep, which it normally does on default settings. On default settings the camera goes to sleep after a duration of time. Changing these default settings was necessary to reduce the chance for Rudy to miss taking images. When the camera goes to sleep, it takes a small amount of time for the camera to wake up, which would hinder the results of the experiment.
Here are the results of the first experiment:
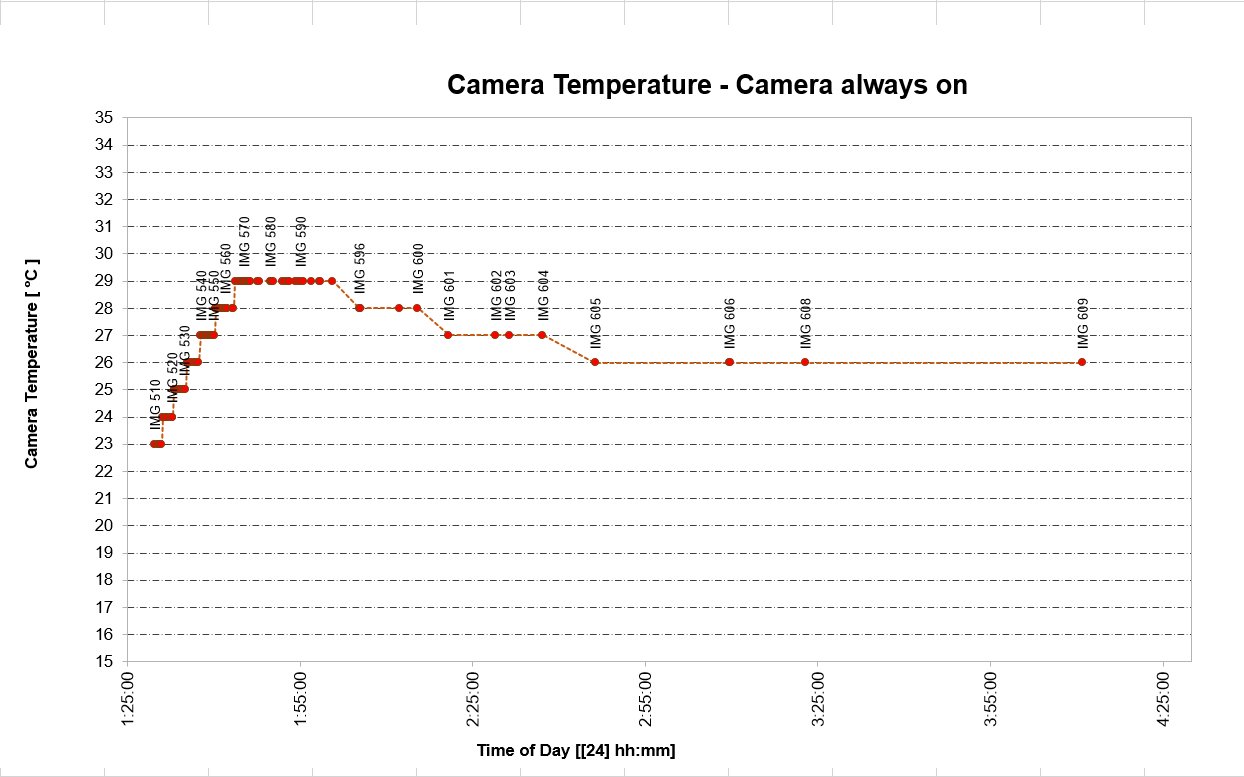
Note: The camera had not cooled down completely to 21 C from a previous experiment, therefore the starting temperature was 23 C. This does not make a great difference once the camera warms up, as you will see in Experiment 2.
The temperature graph looks similar to that of Kris and Lisanne’s EXIF data in some areas. For example, Area 1 shows the same steep increase in temperature as the originals. Area 2 does not show as much temperature variation as in the original data and Area 3 is very different.
Compared to the original case EXIF data, instead of an increase of temperature in Area 3, it shows the temperature hovering steadily at 26 C. The camera does not cool down further because it’s powered on, which creates heat, thus reaching an equilibrium temperature that is above the ambient temperature.
This experiment does not need to be analyzed further. This scenario is unrealistic because the camera was intentionally prevented from going into sleep mode. However, this experiment demonstrates how the camera heats itself, even when the flash is not used, while the camera is left on.
Experiment 2 – Default Settings (Sleep Mode Enabled)
The next experiment was the same as above, except on automatic settings (“Auto”), which involves the camera going into sleep-mode automatically after a while, during which time the camera no longer heats itself.
Test Conditions
Camera: Canon SX270 HS
Settings: Auto
Ambient Temperature: 21 C
Ambient Light: Complete Darkness
Here are the results from Experiment 2:
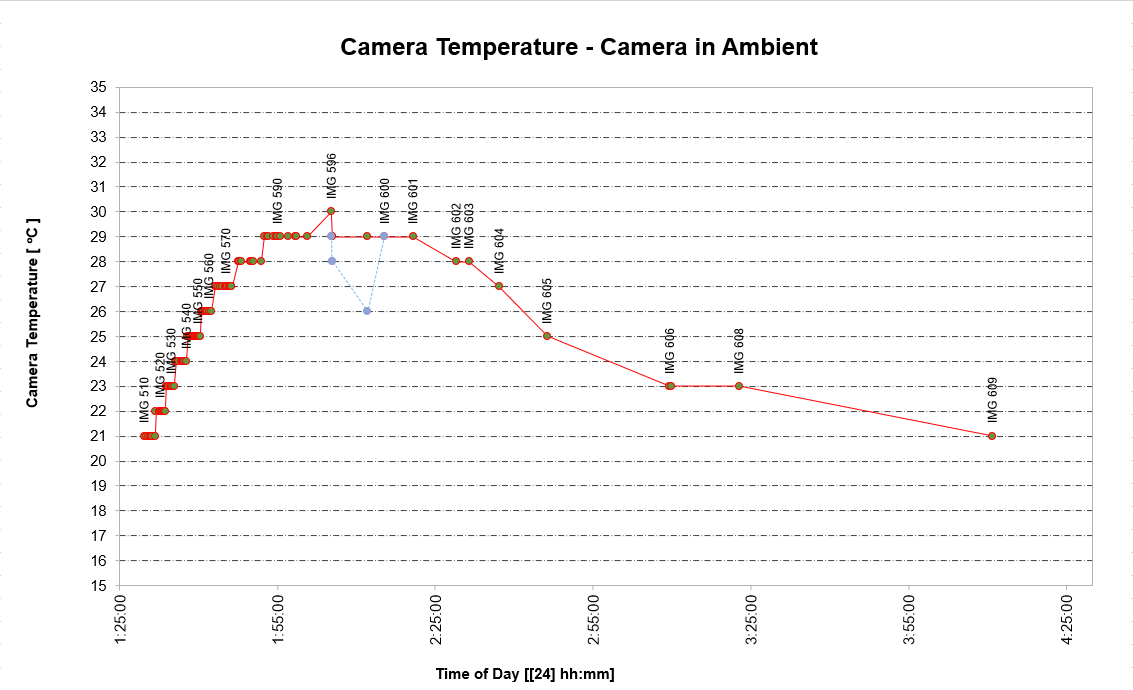
The sensor in the Canon SX270 HS used for this experiment was very accurate and matched the ambient temperature.
The blue line between IMG 596 and IMG 600 was interpolated and shows how much the camera would cool down when not used, based on a theoretical cooling rate of 1 C in 180s. It is not easy to determine this precisely since the measurements of the camera are only in full degrees. The blue line is intended to illustrate the hypothetical cooling-rate of Kris and Lisanne’s camera if it was completely turned off, which it may have been.
The new data from Experiment 2 again illustrates that the camera warms up quickly to 29 C, while the original data shows an increase to only 27 C. Although the relationship between the data is very strong, the small variations were caused by unknown variables, which resulted in the camera warming up slightly less. For example, the experiment was performed without the camera being touched or moved at all. Kris and Lisanne’s camera was likely moved and touched when their original photos were taken, which could affect the manner in which the camera warmed.
Generally, it can be concluded that the increase in camera temperature identified in Area 1, is the typical temperature behavior, when photos are taken with the flash in quick succession.
Area 2 shows differences to the original pictures, as it is rather stable with one temperature peak at IMG 596, while the original data shows the temperature going up and down several times.
As mentioned before, the camera’s temperature differences are likely affected by the manner in which the camera’s programming rounds or truncates the recorded temperature data (see above). Furthermore, the camera’s temperature differences can be affected by other variables, such differences between the simulated conditions vs real conditions. For example, how the camera was held, if it was turned off, if it was moved, if it got wet, if there was a breeze, etc. Generally, Area 2 is reasonably similar to the original data.
Area 3 is very different to the original data. While the experiment shows that camera cooled down to ambient temperature by the time IMG 609 was taken, the data from Kris and Lisanne’s photos show that the temperature increased to 33 C, which is even far above the temperature achieved during the experiment, after prolonged flash use (during Area 1).
This substantial difference merited a third experiment.
Experiment 3 – The Impact Of Body Heat
Besides considering intrinsic issues with the experiment, the only other cause for the discrepancy in temperature could have been that the camera was exposed to a second heat-source besides the camera itself.
Alternative heat sources could have been:
- A fire
- A heated room
- Body heat
The first two possibilities were dismissed as unlikely and the experiment was repeated with the camera being exposed to body heat between images 602 and 609.
The experiment simulated a series of steps in order to mimic the original case data.
As can be seen in the original case photos (from Kris and Lisanne’s camera), the photographer took a continuous series of photos up to IMG 601 and then stopping taking images. During this interruption the camera was turned off, and either held in the photographer’s hand, put into a pocket or tucked into pants, thus providing some degree of contact with body heat.
Then, according to their EXIF data, the camera must have been warmed during the periods of time that no photos were taken.
Considering that the temperature of hands and feet usually has the lowest body temperatures, the camera was tucked into the pants of the test subject in order to duplicate the temperature conditions during the experiment.
The experiment was split into two phases.
Phase 1: Image 510 to 601, the same workflow was utilized as the previous experiments, wherein Rudy took the images according to the same time schedule.
Phase 2: Then the camera was removed from Rudy and the images were manually taken, based on cue from Rudy to ensure the correct timing. In between images the camera was turned off and exposed to the test subject’s body heat, as was previously described above. A few seconds before each shot was taken the camera was removed from the test subject, turned on and the image taken. Directly after the image was taken, the camera was turned off and placed back in position with the test subject.
The results of this experiment are illustrated in the following graph:
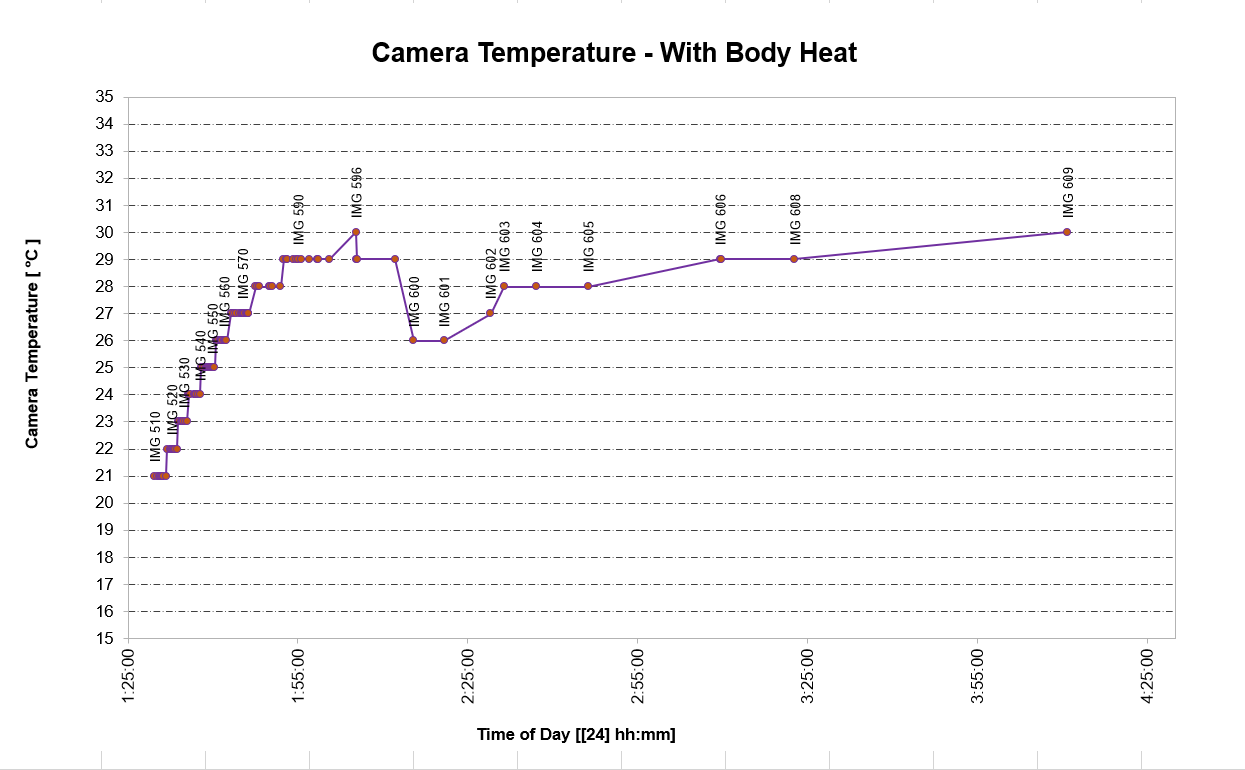
Note that for this graph, the data of the last 8 images that were not taken by Rudy, was overlaid to the previous graph in order to simplify the experiment and make the graph more easily comparable.
The resulting graph is now more similar to the original, however the original peak temperature is 33 C while the peak temperature of the experiment is only 30 C . It is important to remember that there are certain inaccuracies involved when the camera measures and records the temperature. A difference of 1-2 C between two different cameras is therefore not unreasonable to expect. Another unknown factor is the difference in body temperature of the original photographer and the test subject and the exact treatment of the camera when the original images were taken. A variety of subtle factors were likely the cause of the differences in the results.
Below the original data and the “body heat experiment” data were combined into one graph for easier visualization:
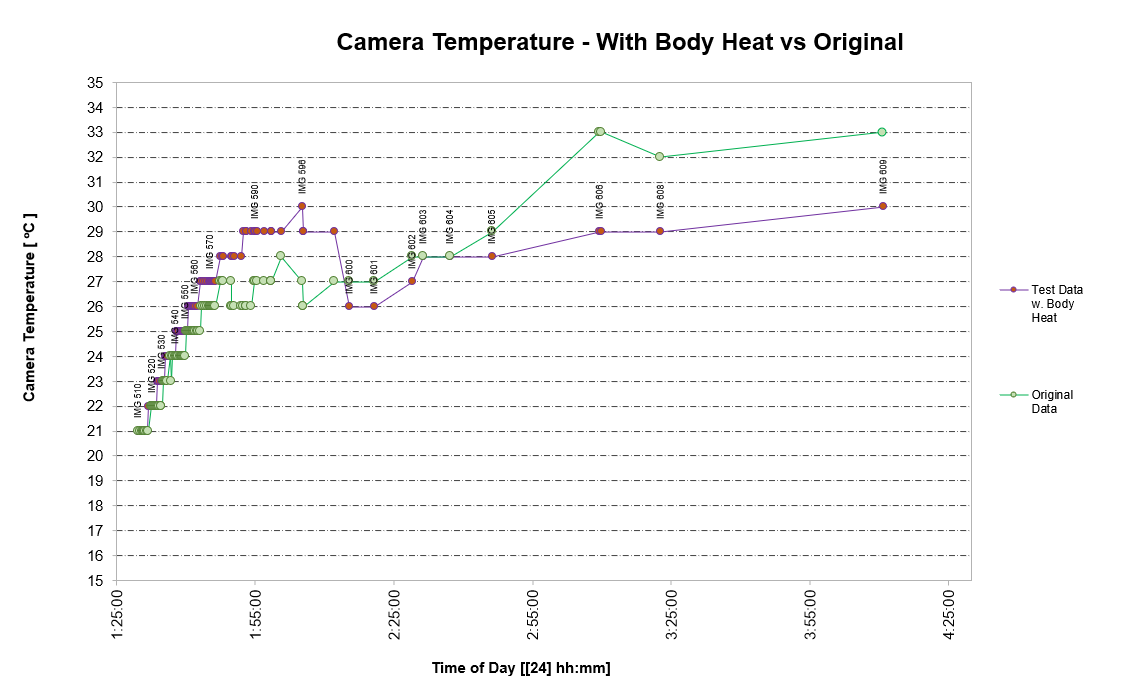
The two graphs match qualitatively but because the exact original conditions are unknown and because the experiment was conducted under static conditions, it is apparent that there are differences.
Conclusions & Takeaways
The experimental data confirms that the camera heated up quickly during the first roughly 70 images. Then there was a period of more or less constant camera temperature where the images were taken with less frequency and the camera was able to cool between images. Finally the last 8-10 images where the camera was exposed to an external heat source that could have been body heat.
The experiment shows that:
- The camera was turned on and off during taking of the night photos.
- The camera was not placed on the ground or in the backpack while the last 8 – 10 images were taken.
- There was an external heat source that the camera was exposed to.
- The camera temperature can occur naturally, i.e. during normal anticipated use of the camera
It can be speculated that:
- The person taking the images put the camera into a pocket or other location where it was close to body heat.
- The photographer’s body temperature was normal or could have been higher than that of the test subject
- The person taking the images was alert and conscious since they turned the camera on and off multiple times and placed the camera in a “storage location”, e.g. pocket between some of the images while it was not in use.
What can be ruled out with this experiment is:
- The camera fell onto the ground and “took” the images by itself
- The camera took the images by itself due to unspecified malfunction
- An animal “took” the images while manipulating the camera in some fashion
The data and the experiment does not show signs of data manipulation and does not show signs of influence of third parties. However, it can also not be ruled out since any person could have taken the photos as described above.
It is the author’s opinion that there is no evidence of wrong doing based on the data discussed in this article.
A Few Final Comments From Chris
I’d like to extend a big “thank you” to Matt for this excellent work and Jürgen Snoeren for collaborating with Matt to make this possible. This new information is yet another important piece of the puzzle that contributes to our understanding of the disappearance case of Kris Kremers and Lisanne Froon.
I found it particularly interesting that the initial ambient temperature was 21 C (69.8 F) and that the camera temperature increased after the initial cluster of photos, most likely from body heat. This supports our evolving theory, that maybe Kris and Lisanne had opted to go further north from River 3, towards lower elevations and higher temperatures.
Altogether, this information helps us to better understand some details about when the night photos were taken. Matt did a fantastic job at reconstructing the known conditions that were necessary to conduct these experiments.
Additionally, thank you to all of our supporters and followers as we make progress in this work.
I’m hugely impressed by you guys in terms of your attention to detail and rigorous analysis. Such a contrast to all the wild and ill-informed speculation about this case that characterises the offerings of most commentators. Keep up the good work!
Maybe it doesn’t correspond to this post, but something about the photo of Kris’s head in the night photos caught my attention. You can see that in the lower right part 2 types of fur come together, if you look closely in that area, you can see Kris’s hair and a darker one, apparently Lissane’s. This suggests to me in my speculation that the two heads were together and that the person who took the photos is a third party. It’s a bit awkward to take a selfie with both heads together if one of them is the one who took the photo.
Hi Matt, Romain and Chris,
* Assuming an ambient out-door temperature of 21 degrees at nighttime and at a certain altitude, is tricky.
* The trail’s out-door ambient temperature at nighttime in April 2014 should have been around 14-15 degrees instead of 21 degrees.
* Have you ever considered the possibility of the 21 degrees to be an in-door temperature?
In the afternoon of April 1st, Kris and Lisanne had no need to search for warmer temperatures. Yet something significant took place between 14:00 and 18:00 hours, when they decided to switch off their phones.
And apparently they also didn’t feel the need to use their phones for light nor for orientation purposes. (Whereas previously they had used Lisanne’s phone to navigate up to the Mirador)
Cheers!
You are right, but the photos were clearly taken outdoors. But the ambient temperature recorded by the camera seems higher than expected for the cloud forest at night. Conclusion: they were not there… they must have been somewhere else, outdoors in the jungle but at a much lower elevation, nearer to the shore.
Hello Chris I would like to ask a couple of questions.
First, is there data from the water ingress indicator in the iPhone 4 ?
Second , when the iPhone 4 got wet on April 1 , maybe it was logical to pull out the battery ?
Third , When heating the Canon SX270 HS to 33 degrees , warm your hands or press it to your chest , thereby warming up a little ?
Fourth , after studying the night photos , the illumination in some cases looks more like a knee than a finger , or can I be wrong ?
Fifth , if the legs of both were damaged , then this explains why they did not climb to the top of the mountains to catch a signal , but moved in niches , that is , in the dolb of the river ?
You have done a great job, I am delighted.
In this case, of course, the Panamanian police did a very bad job, with the naked eye we can say that because of their shortcomings there are now so many questions.
Thank you for this experiment and for share the result with us.
We all hope to find the truth one day
Dear Chris,
With respect to another commenter’s question about the purpose of the night photos I want to share an idea I had recently. What if a person was using the green light when you hold the trigger down for light to see, then intentionally firing the flash away from the face(s)?
My theory is the camera was submerged, and inoperable since picture 508 (the disturbance that caused submersion also could have caused 509)
Perhaps they/she used the green light to build the SOS and or to examine drinking water?
I enjoyed the comments section and contributors maybe more than the actual article!
A lot of great discussion people, thank-you.
It is interesting to note that from information divulged in the book Dutch Doh-handlers recorded the temperature in the Alto Romero area during the day as rising to as much as 37c, while at night, as they camped on the way to the river and its Backpack spot, it dropped to as little as 10c according to the searchers.
That’s all much further to the north from where the second bridge is, but between the Imperfectplan’s experiences and this other firsthand data it does seem that night temperatures do drop considerably – this is not a tropical Jungle. If you take the Imperfectplan night temperature as an average for the rough location Lisanne and Kris were theoretically ‘lost’ by April 8th, then factor in possible clear skies on the first night alone, it is hard to imagine Hypothermia not being a reality. Of course, this is assuming the two were out there, or even out there for the supposed full eight days and night (plus).
But one factor not discussed in this article is the effect of the nights rain on local temperatures. Just how cold (or warm) would this rainfall be? Although it seems the photographer is mostly sheltered from it, the combination of the sustained rainfall and deepening hours, does seem like a dangerous combination. You can see some rainfall appearing on the camera lens itself occasionally, so between this and ambient moisture by dawn the temperature should be… how low?
I don’t think you can dwell too much on the temperature on the Camera, there are too many unknown factors in it. But it does influence the question over what degree hypothermia was a risk at the time. Let’s bear in mind that in theory these two would have been sat in complete darkness from around 7pm to around 7am next morning, that is a long long night to be sat on bare hard rock, with no protection, no light, no food, and it does make me question just how likely it is that both of the two friends are immobile for this length of time, and for a theoretical several days and night… it doesn’t quite ring true to me.
Hi Chris,
It’s amazing that after 7 days and nights that hypothermia never seemed set in for either Kris and/or Lisanne, despite their meager clothing and sustenance, injury, and whatever else you want to tack on like insect bites, scrapes, gashes, that could have become infected. Nevermind the broken hip or whatever other major injury was plaguing them to be able to walk down this mysterious path of slippery rocks that nobody including the guides were familiar with, without a machete.
And then if you factor that Lisanne had been nursing a pre-existing cough or chest cold, along with a pre-existing injury which according to her parents had forced her to quit volleyball and flared up while in Bocas already, then it is quite fascinating she manages to survive all those nights and days.
Even after it rained on April 3, 4 and 5 and a bit on the 7th, as ETESA data showed, wouldn’t they have been soaked as per your analysis and succumbed to hypothermia by at least the 5th?
And then supposedly Lisanne was able to take perfectly composed, sharp photos without a shiver for 2.5 hours, while having the sense to turn on and off the camera at intervals, to conserve battery at the same time? Yet they do not use their phones on the 6th, 7th which was their only extension to the outside world?
At least Lisanne or whoever the 3rd party was, did a far better job than the sturdiest tripod.
I must say that these night photos goes against a lot of your previous data collection and analysis about temperatures in the forest that you wrote about. Hypothermia can set in within minutes to hours given the temperatures you quoted before, and considering the gear Kris and Lisanne had on without the means to warm themselves.
Your observation of 5-7 locals seen between the 1pm – 3pm time in the day was interesting to note. It may have been more or less people back in 2014, but at 2pm just after the last photo was taken there would have been on average at least 2-4 people I’d imagine going or returning from Boquete to get home. Yet these two striking foreigners weren’t spotted long enough for them to just vanish without a trace, on a one-way path?
I was hoping for all your analysis and tests to make the least amount of assumptions but even with the actual police files you aren’t able to get away from that.
To go wandering off down some River channel when Lisanne and Kris clearly had the means to tell the time on their phones at the 2pm mark, meant they knew how much time they had left to head back, to check in with their parents, and have dinner with Miriam and her family. So I don’t find your theory of them just deciding to go down a River channel, especially having seen Romain’s videos of how not easy it was to just get past River 3 on what looked like slippery rocks.
But I have to wonder in regards to this article then is to what purpose were these 90 odd night photos taken? Since you stated in the previous article that rivers you encountered were quite loud, then how could Lisanne and Kris have heard anyone or anything much less see anything in the dark, in their condition and while it rained? Too many contradictions and not much substance.
And the idea of them using the camera to see in the dark on April 8 morning is even more ludicrous. Since you said they might not have used their phones due to the light attracting what did they do on the previous nights to “see” in the dark? Did they wear night vision goggles or something?
Oh and lastly did Jurgen or Matt go to Panama to test out their automaton? It would have been far more credible if they actually set foot in Panama and performed these experiments in the actual environment preferably in the month of April.
Well at least Romain is trying to set some apples to apples comparison by going out there in April as you stated. We hope he comes through with better reliable data.
Thanks for sharing.
Hi Jade, thank you for your comment.
There are too many unknowns to know exactly what happened. We’re merely aggregating information and offering some insights into what could have happened, with consideration to variables that can affect their circumstances. Naturally, more information would be needed to make conclusive statements.
I’ll try to answer some of your questions:
Even after it rained on April 3, 4 and 5 and a bit on the 7th, as ETESA data showed, wouldn’t they have been soaked as per your analysis and succumbed to hypothermia by at least the 5th?
Not necessarily. If they had continued walking north on the trail, they would have faced warmer temperatures at lower elevations, which would reduce the chance of hypothermia. The camera’s starting temperature data suggests the ambient temperature was 21C (at ~1:30AM), which is warmer than average night temperatures at Rivers 1,2,3 (during that time of the season).
Yet they do not use their phones on the 6th, 7th which was their only extension to the outside world?
I agree that their phone activity is unusual in many respects, especially considering that it would have been their only emotional safe-haven. It’s still shocking to me that both phones were turned-off for the entirety of the first night of the disappearance.
Hypothermia can set in within minutes to hours given the temperatures you quoted before, and considering the gear Kris and Lisanne had on without the means to warm themselves.
Based on the camera’s ambient temperature of 21C, this leads me to believe that hypothermia was less likely to be a factor. Of course, we cannot say for certain why 21C was the camera’s initial temperature. For example, if it had already warmed-up slightly from body heat, then perhaps the ambient temperature was cooler.
But I have to wonder in regards to this article then is to what purpose were these 90 odd night photos taken?
Nobody knows.
Since you said they might not have used their phones due to the light attracting what did they do on the previous nights to “see” in the dark?
Nobody knows. When our light was off, our only two options were: 1. Stay in place, or 2. Risk injury. Given the availability of the moon-light, it’s possible their eyes adjusted giving them a minimal amount of visibility. However, the trees and vegetation would greatly reduce any moon/natural light. We were unable to see without a light.
Did they wear night vision goggles or something?
I’m sensing sarcasm 😉
Oh and lastly did Jurgen or Matt go to Panama to test out their automaton?
Nope. There are too many unknown variables that would make it very difficult to replicate the exact scenario: Wind, precise location, angle of camera, hand-temperature, precipitation, etc. The only place ambient temperature can be replicated at exactly 21C is indoors, thus reducing any undesirable/unknown variables (ambient temp changes, precipitation, etc). But you’re welcome to go to Panama and collect some data in the region.
We love to see people getting involved and finding answers, through research, data collection, etc. Every little piece of information helps.
Thanks again. Cheers.
Outstanding work.
Dear Chris, thanks again for your extensive research! You have even constructed “Rudy”!
Very clear explanation about your experiments and findings.
You have explained why you have chosen for an ambient temperature of 21C as a starting temp to work with (in practice turned out to be 23C due to previous use of the camera).
But I wonder why you didn’t chose for an ambient temp of 17-18 degrees instead?
The night temperatures you guys had measured at the 2nd Camp were:
– 17,3 degrees in March, at 02.10 hrs
– 14,8 degrees in July at 04.25 hrs
Why not chose a lower ambient temp for Rudy to work in?
Also, it would be interesting to see how temps in phase 3 would turn out at 17-18C ambient instead of 21C (23C).
Thank you for your comment and support!
All of the credit for this article goes to Matt and Jurgen.
Matt chose the starting ambient temperature of 21C because that is the same starting temperature recorded in the first few night-photos from Kris and Lisanne’s camera. There’s no evidence that prior photos were taken on that night, so the camera’s flash wouldn’t have warmed the camera, although certainly we do not know what potential heat sources could have been present. Without more information, the 21C temperature is the most accurate reading we can determine.
We certainly could conduct tests with lower ambient temperatures, but the outcome/graphs would be very similar (minus x degrees, of course).
In the end, without more data or evidence, 21C is the most-accurate ambient temperature that we were able to identify. We would need more case data or evidence to believe otherwise. And of course, occasionally we learn new pieces of case information, which could result in further testing.
Thank you again for your comment.
Cheers
Thank you for this creative and difficult research.
Thank you Constance!